SEO for Small Business: Google Analytics
If you have been following this series over the last couple of weeks, hopefully you will now have your website linked with Google Analytics and are currently busy working on link building as part of your seo strategy.
Until your digital marketing efforts convert to enquiries or sales though, how can you know that what you are doing is effective? After all, success in search engine rankings doesn't happen overnight. It is time to dive into the numbers and have a look at what they mean and what they are telling you about your marketing strategy.
In this article we will look at real time reporting and an overview of your audience. This is not intended to be an in-depth look into Google Analytics, but just a high level overview helping you to quickly understand at a glance how your website is performing. For complete training on measuring and analysing the performance of your website I highly recommend speaking with a good seo company, however this series is about empowering you, the small business owner, with the tools to do what you can for free.
Ready to get stuck in? Let's take a look at what is happening on your website right now...
Real-Time > Overview
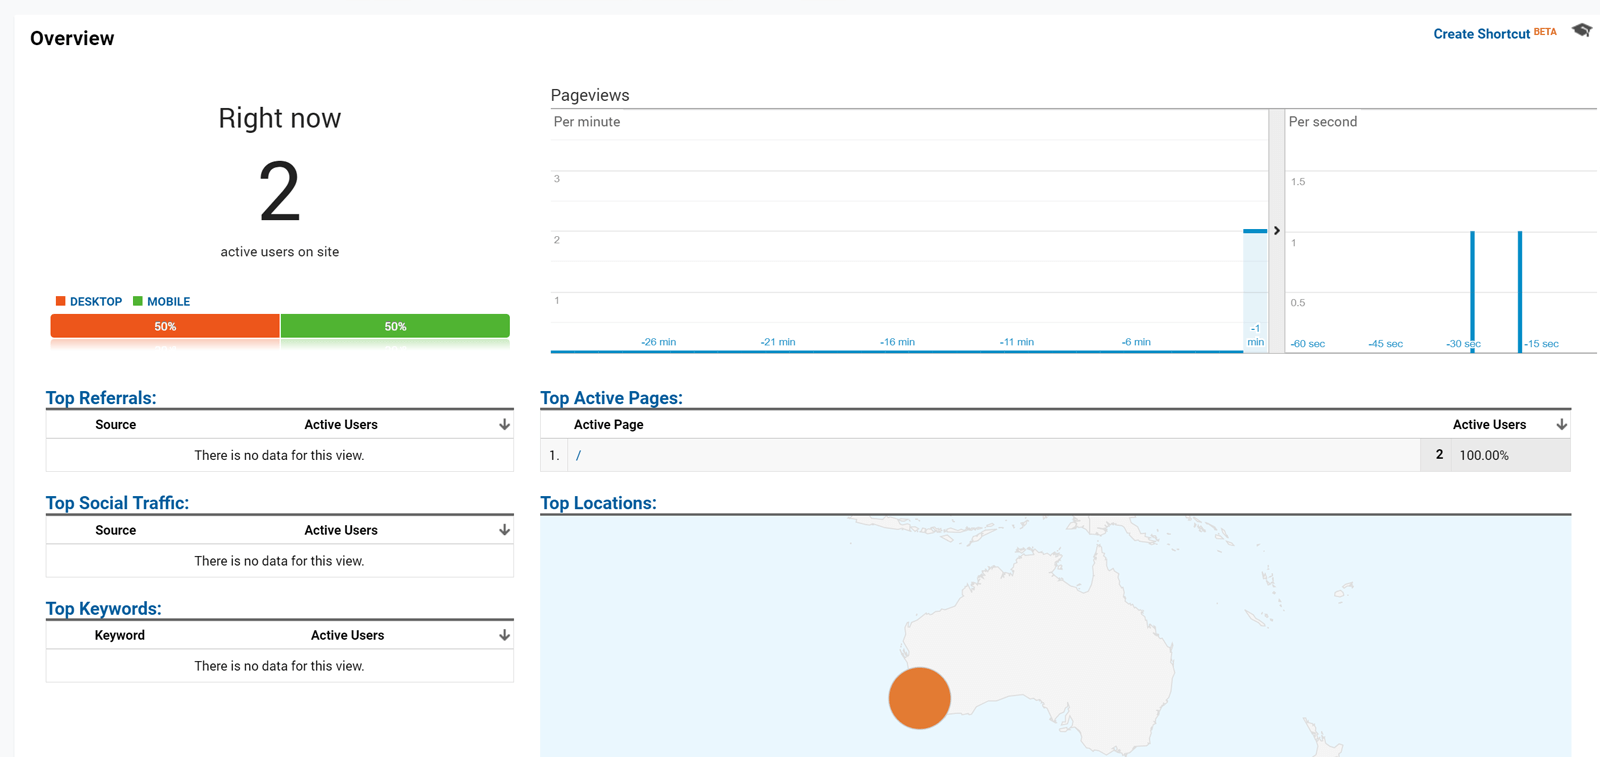
Log into Google Analytics then from the left hand menu click on Real-Time, then click on Overview.
The first thing you will notice is the number of users that are active right now. You also get a break down of their device here: Desktop, Tablet or Mobile.
On the right hand side you will see real time page views split into Per Minute and Per Second. Top Active Pages shows you how many people are on which pages right now, and you can also see Top Referrals (where your visitors came from), Top Social (which social media platforms are bringing visitors) and Top Keywords (the search terms people typed into search engines before clicking on your link). Finally, a map gives you a visual as to where in the world your visitors are from.
So how does any of this help? Aside from being pretty cool to see, Real-Time gives you insight into how uses are responding instantly to the things you do. For example, if you have just posted something on social media, seeing Active Visitors and Top Social increase would indicate it was successful.
Similarly, if you have just published a blog post and promoted it in various places you would expect to see it in the Top Active Pages and another expectation would be that Top Referrals and Top Social would increase.
Tracking the effectiveness of non-digital marketing is also possible using digital methods. If you have a TV or radio advert that you know is about to air, have a look at Real-Time to check how effective it is - are visitors increasing while the advert is on air? How about immediately after the advert? If not, does the advert direct people to the website?
If you can determine that the action you took had a positive impact on your website traffic, then you know you can do more of that. If however it has not been effective, get your thinking cap on to work out what the cause might be - could it be the wrong time of day, the wrong content, the wrong media? Make any required changes and then re-evaluate.
Audience > Overview
Real-Time is fantastic for the here and now, but what happens when the visitor departs? How do you know what has been happening while you are not monitoring live action? This is where the Audience Overview comes into it and it is a great place to get a snapshot of how your online presence is performing over time.
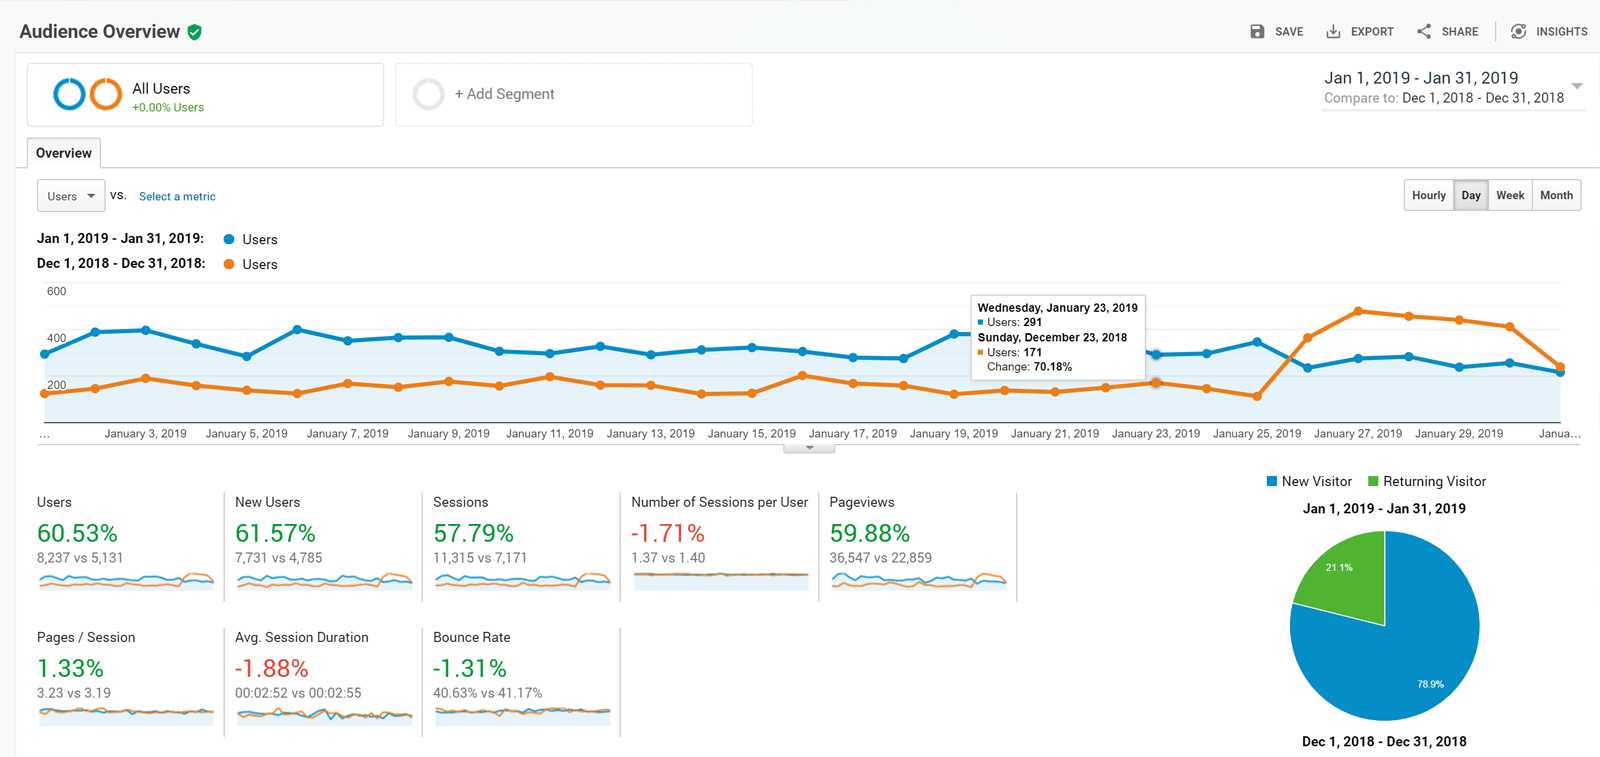
By default the overview will display the last 7 days but you can modify the date range to see weeks, months or even years, comparing periods to provide you with a visual of how much your website has improved. The graph is good for this, but some interesting numbers follow.
Users: This is the total number of visitors you have had to your website in the given date range and both new and returning visitors are included. For example, if I visit your website 3 times, I would count as 3. This number is normally a good indicator that all your search engine optimisation efforts as a whole are impacting on your website performance. The number of users will increase by default as your website starts to rank better and similarly will decrease if your search rankings get worse.
New Users: This is how many unique users there were visiting your website in the given date range and while the "Users" includes returning visitors, this number only increments the first time a person visits. As an example if I visited your website 3 times, I would only count as 1 visitor.
Average Session Duraton: Knowing how long a visitor interacts with your website provides an indication as to the relevance of your website. Remember that search engines reward relevant web pages in search engine results so if people are not even spending a minute on your website you probably need to look at writing more content or having clearer calls to action so that a user will visit and read multiple pages.
Bounce Rate: Another indicator of relevance is the bounce rate and this refers to the number of people who leave your website instantly. The higher this rate is, the less relevant a search engine will see your website negatively impacting your rankings as a result. To decrease this number, you need relevant content, clear calls to action and a logical website flow leading the user from one page to the next.
The last thing we will discuss on this very high level view of Google Analytics is the New vs Returning pie chart. If your website is relevant and regularly has fresh content on it, visitors will return. While New Users shows that your online marketing is working, you do also want Returning Users - so in my opinion the best possible outcome for this chart would be 50/50. In reality though there is normally a lot more new users so don't stress, just keep it in mind that you need to focus on both improving your online visibility AND improving your relevance. The interesting thing here is that the more you focus on relevance, the more your online visibility will improve, bringing more new and returning users.
- - - -
The level of detail you can extract from Google Analytics - and all for free - is insane, but these are some key areas that will enable you to make the right changes in the right places. Enjoy optimising, analysing and monitoring your own website, and as always if you would like us to provide the SEO service for you, we are just a phone call or email away.